Indy Survey Tool: A framework to unearth correlations in survey data
Abstract
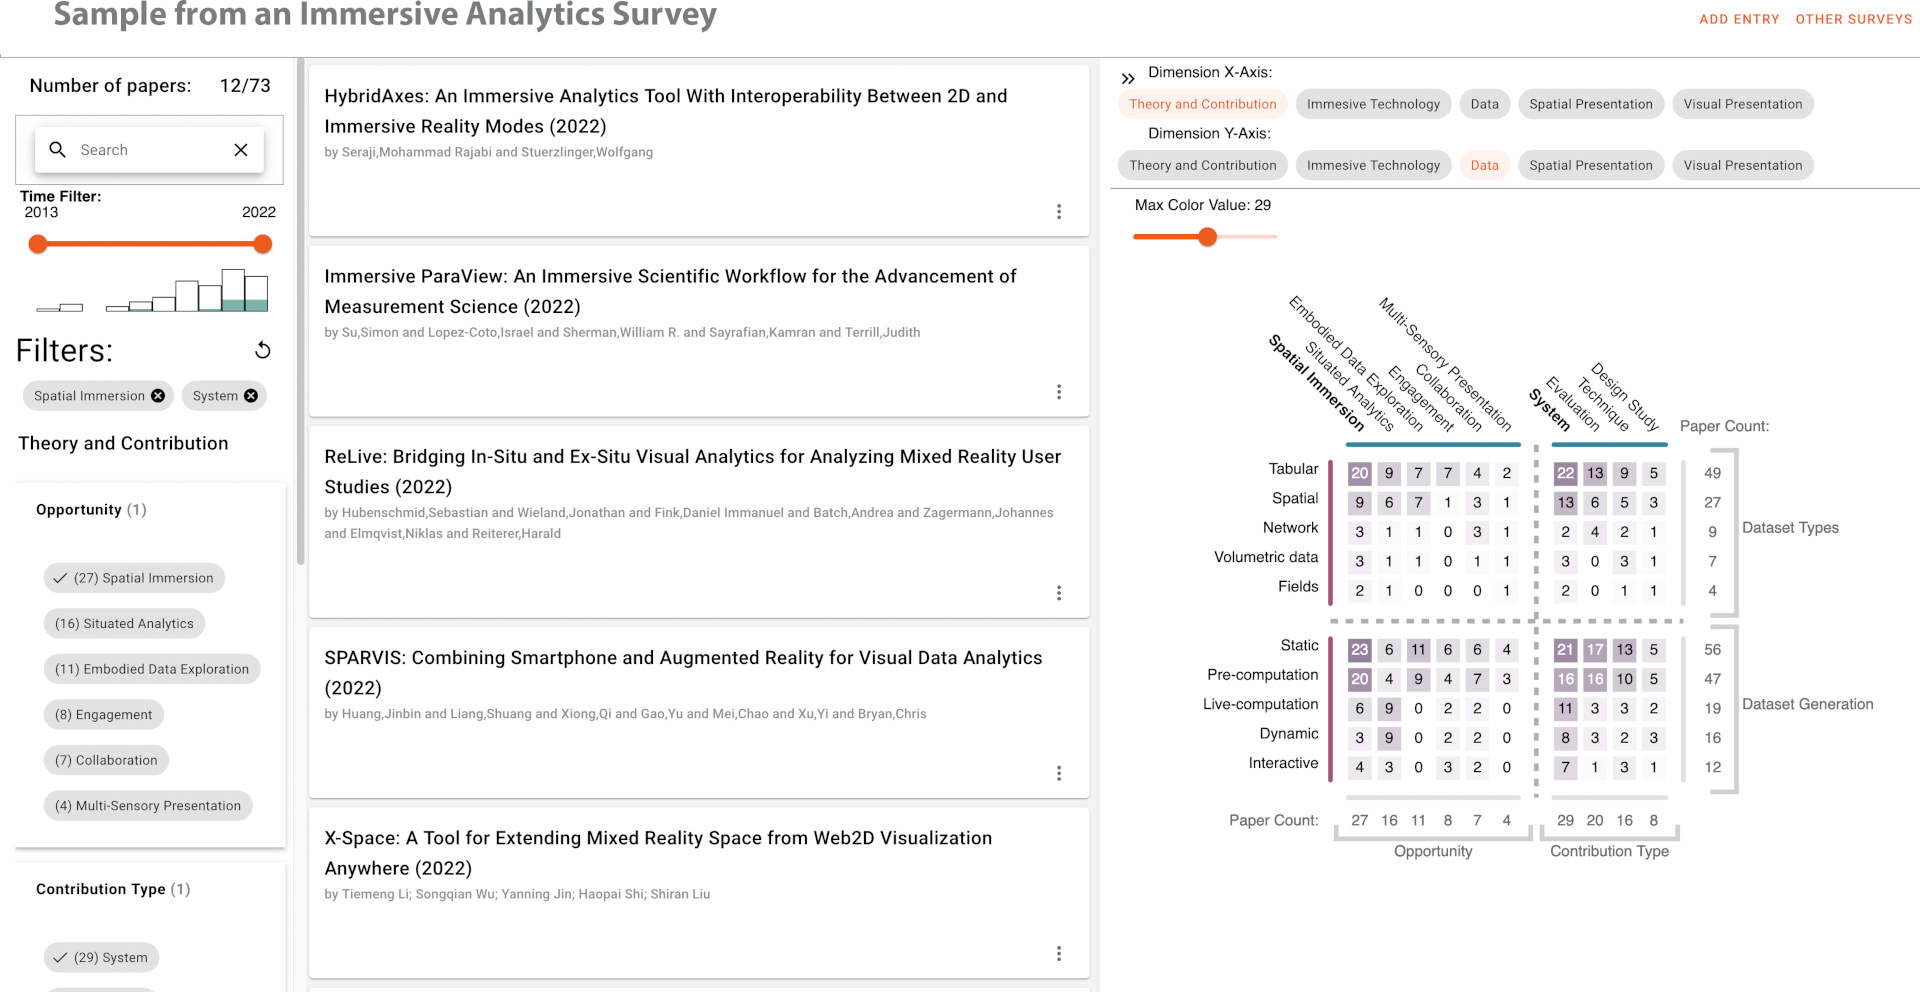
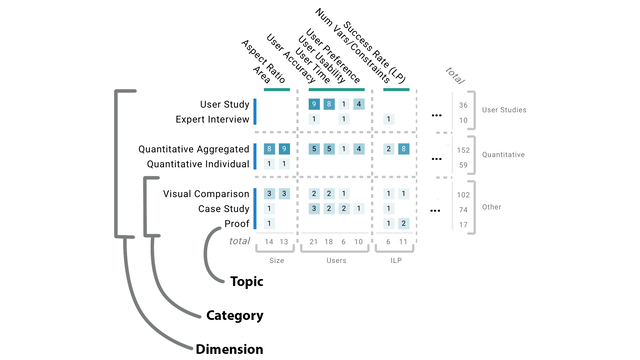
Survey companion websites allow users to explore collected survey information more deeply, as well as update or add entries for papers. These sites can help information stay relevant past the original release date of the survey paper. However, creating and maintaining a website can be laborious and difficult, especially when authors might not be experienced with programming. We introduce Indy Survey Tool to help authors develop companion websites for survey papers across diverse fields of study. The tool's core aim is to identify correlations between categorizations of papers. To accomplish this, the tool offers multiple combined filters and correlation matrix visualizations that enable users to explore the data from diverse perspectives. The tool's visualizations, list of papers, and filters are harmoniously integrated and highly responsive, providing users with feedback based on their selections. Identifying correlations in survey papers is a pivotal aspect of research, as it can enable the recognition of common combinations of categorizations within the papers—as well as highlight any omissions. The versatility of Indy Survey Tool enables researchers to delve into the correlations between categorizations in survey data, an essential aspect of research that can reveal gaps in the literature and highlight promising areas for future exploration. A preprint and supplemental material for the paper can be found at osf.io/tdhqn.


Citation
Indy Survey Tool: A framework to unearth correlations in survey data
Tarik Crnovrsanin, Sara Di Bartolomeo, Connor Wilson, and Cody Dunne. Proc. IEEE Visualization Conference—VIS. 2023.
PDF | Preprint | Supplement | Code | BibTeX
Cody Dunne, Vis Lab — Northeastern University
West Village H, Room 302F
440 Huntington Ave, Boston, MA 02115, USA