Investigating the visual utility of differentially private scatterplots
Abstract
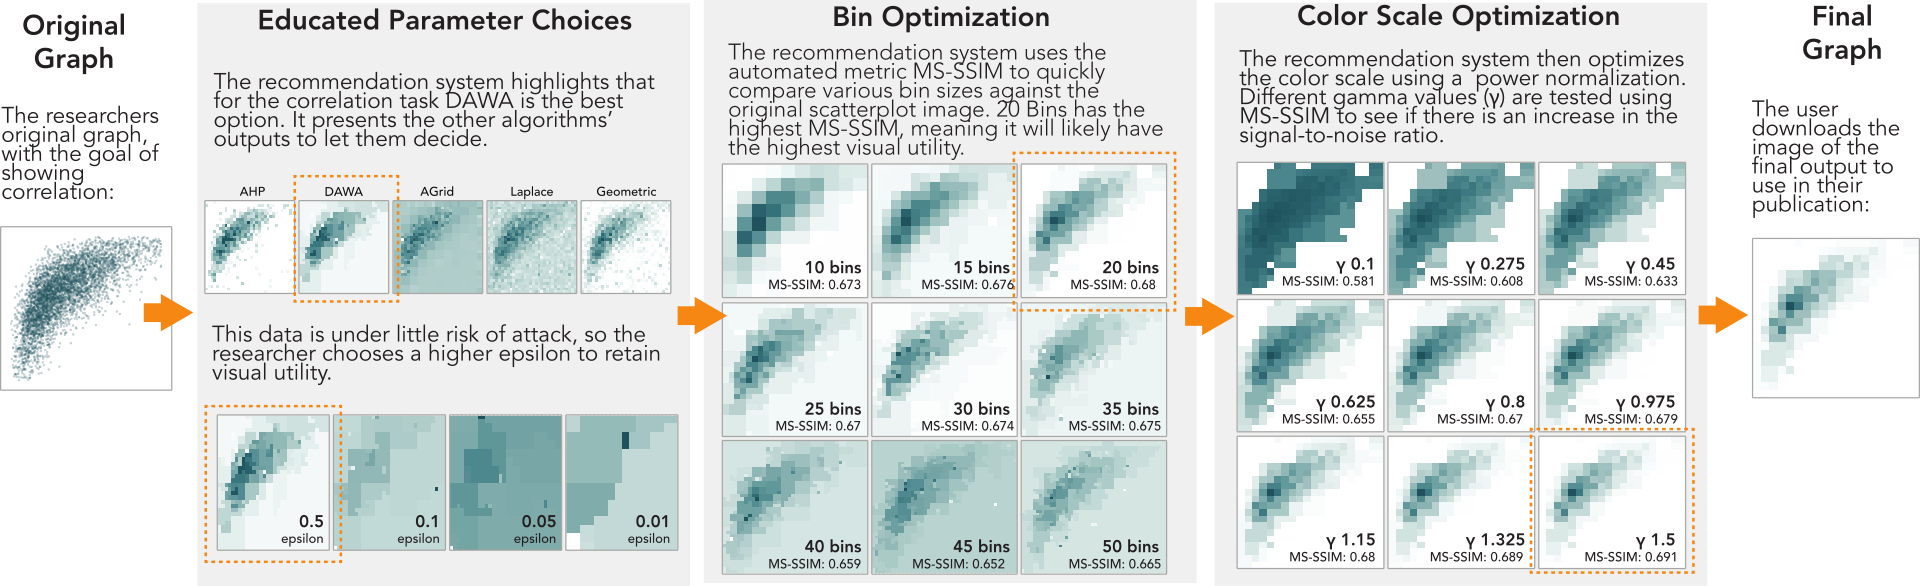
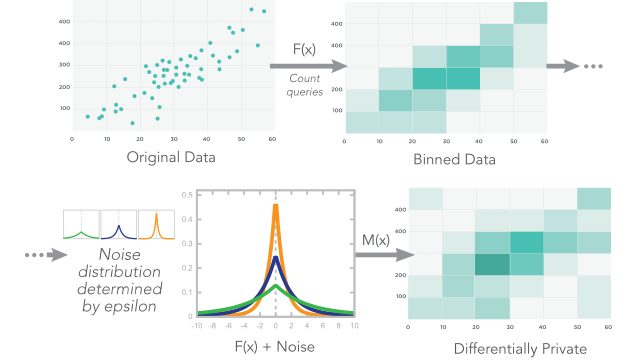
Increasingly, visualization practitioners are working with, using, and studying private and sensitive data. There can be many stakeholders interested in the resulting analyses-but widespread sharing of the data can cause harm to individuals, companies, and organizations. Practitioners are increasingly turning to differential privacy to enable public data sharing with a guaranteed amount of privacy. Differential privacy algorithms do this by aggregating data statistics with noise, and this now-private data can be released visually with differentially private scatterplots. While the private visual output is affected by the algorithm choice, privacy level, bin number, data distribution, and user task, there is little guidance on how to choose and balance the effect of these parameters. To address this gap, we had experts examine 1,200 differentially private scatterplots created with a variety of parameter choices and tested their ability to see aggregate patterns in the private output (i.e. the visual utility of the chart). We synthesized these results to provide easy-to-use guidance for visualization practitioners releasing private data through scatterplots. Our findings also provide a ground truth for visual utility, which we use to benchmark automated utility metrics from various fields. We demonstrate how multi-scale structural similarity (MS-SSIM), the metric most strongly correlated with our study's utility results, can be used to optimize parameter selection. A free copy of this paper along with all supplemental materials is available at osf.io/wej4s.
Authors


Citation
Investigating the visual utility of differentially private scatterplots
Liudas Panavas, Tarik Crnovrsanin, Jane Lydia Adams, Jonathan Ullman, Ali Sargavad, Melanie Tory, and Cody Dunne. IEEE Transactions on Visualization and Computer Graphics—TVCG. 2023. DOI: 10.1109/TVCG.2023.3292391
PDF | Preprint | DOI | Supplement | Preregistration | Code | BibTeX
Cody Dunne, Vis Lab — Northeastern University
West Village H, Room 302F
440 Huntington Ave, Boston, MA 02115, USA