Unraveling the design space of immersive analytics: a systematic review
Abstract
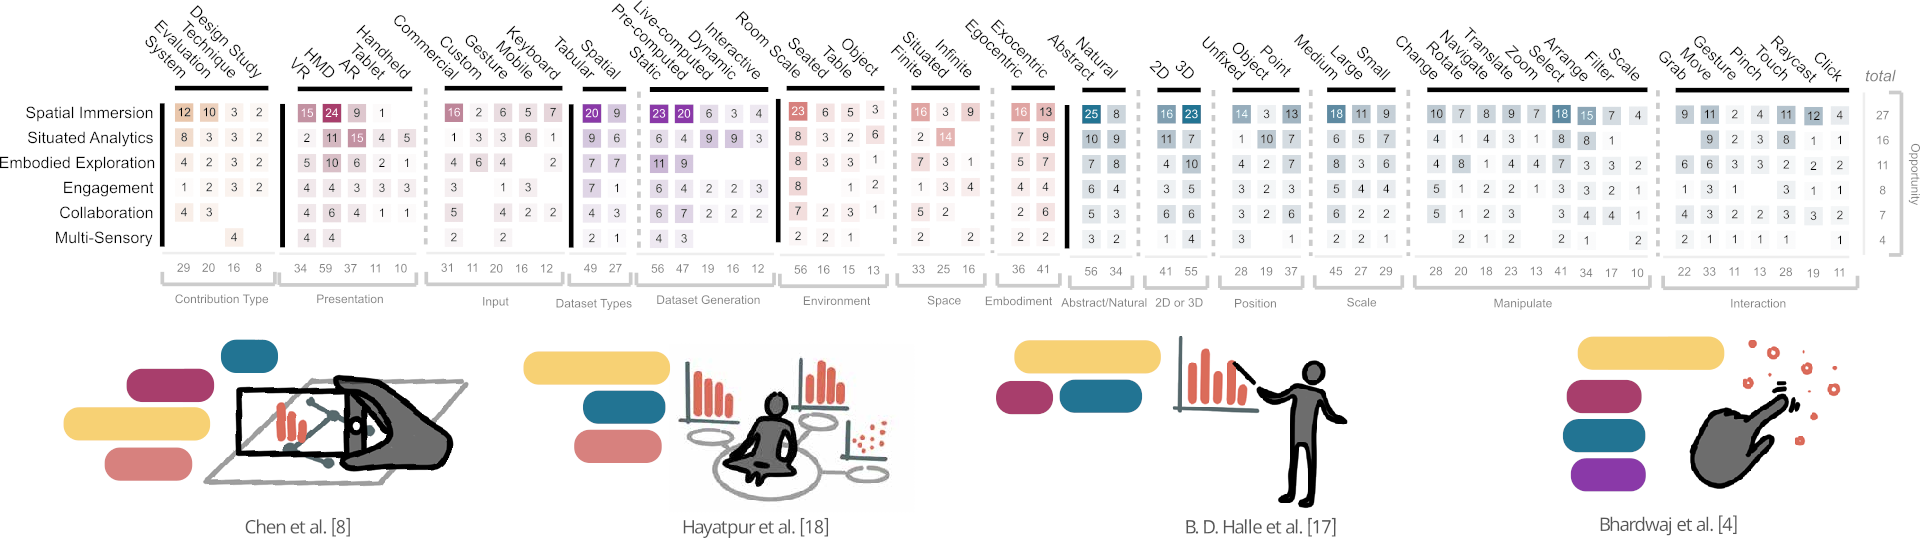
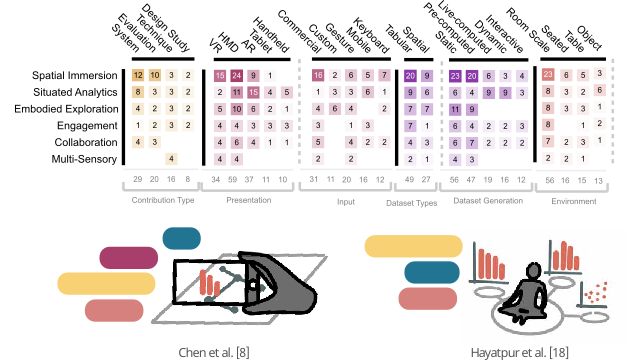
Immersive analytics has emerged as a promising research area, leveraging advances in immersive display technologies and techniques, such as virtual and augmented reality, to facilitate data exploration and decision-making. This paper presents a systematic literature review of 73 studies published between 2013-2022 on immersive analytics systems and visualizations, aiming to identify and categorize the primary dimensions influencing their design. We identified five key dimensions: Academic Theory and Contribution, Immersive Technology, Data, Spatial Presentation, and Visual Presentation. Academic Theory and Contribution assess the motivations behind the works and their theoretical frameworks. Immersive Technology examines the display and input modalities, while Data dimension focuses on dataset types and generation. Spatial Presentation discusses the environment, space, embodiment, and collaboration aspects in IA, and Visual Presentation explores the visual elements, facet and position, and manipulation of views. By examining each dimension individually and cross-referencing them, this review uncovers trends and relationships that help inform the design of immersive systems visualizations. This analysis provides valuable insights for researchers and practitioners, offering guidance in designing future immersive analytics systems and shaping the trajectory of this rapidly evolving field. A free copy of this paper and all supplemental materials are available at osf.io/5ewaj.
Authors


Citation
Unraveling the design space of immersive analytics: a systematic review
David Saffo, Sara Di Bartolomeo, Tarik Crnovrsanin, Laura South, Justin Raynor, Caglar Yildirim, and Cody Dunne. IEEE Transactions on Visualization and Computer Graphics—VIS/TVCG. 2023.
Cody Dunne, Vis Lab — Northeastern University
West Village H, Room 302F
440 Huntington Ave, Boston, MA 02115, USA