Analyzing student travel patterns with augmented data visualizations
Abstract
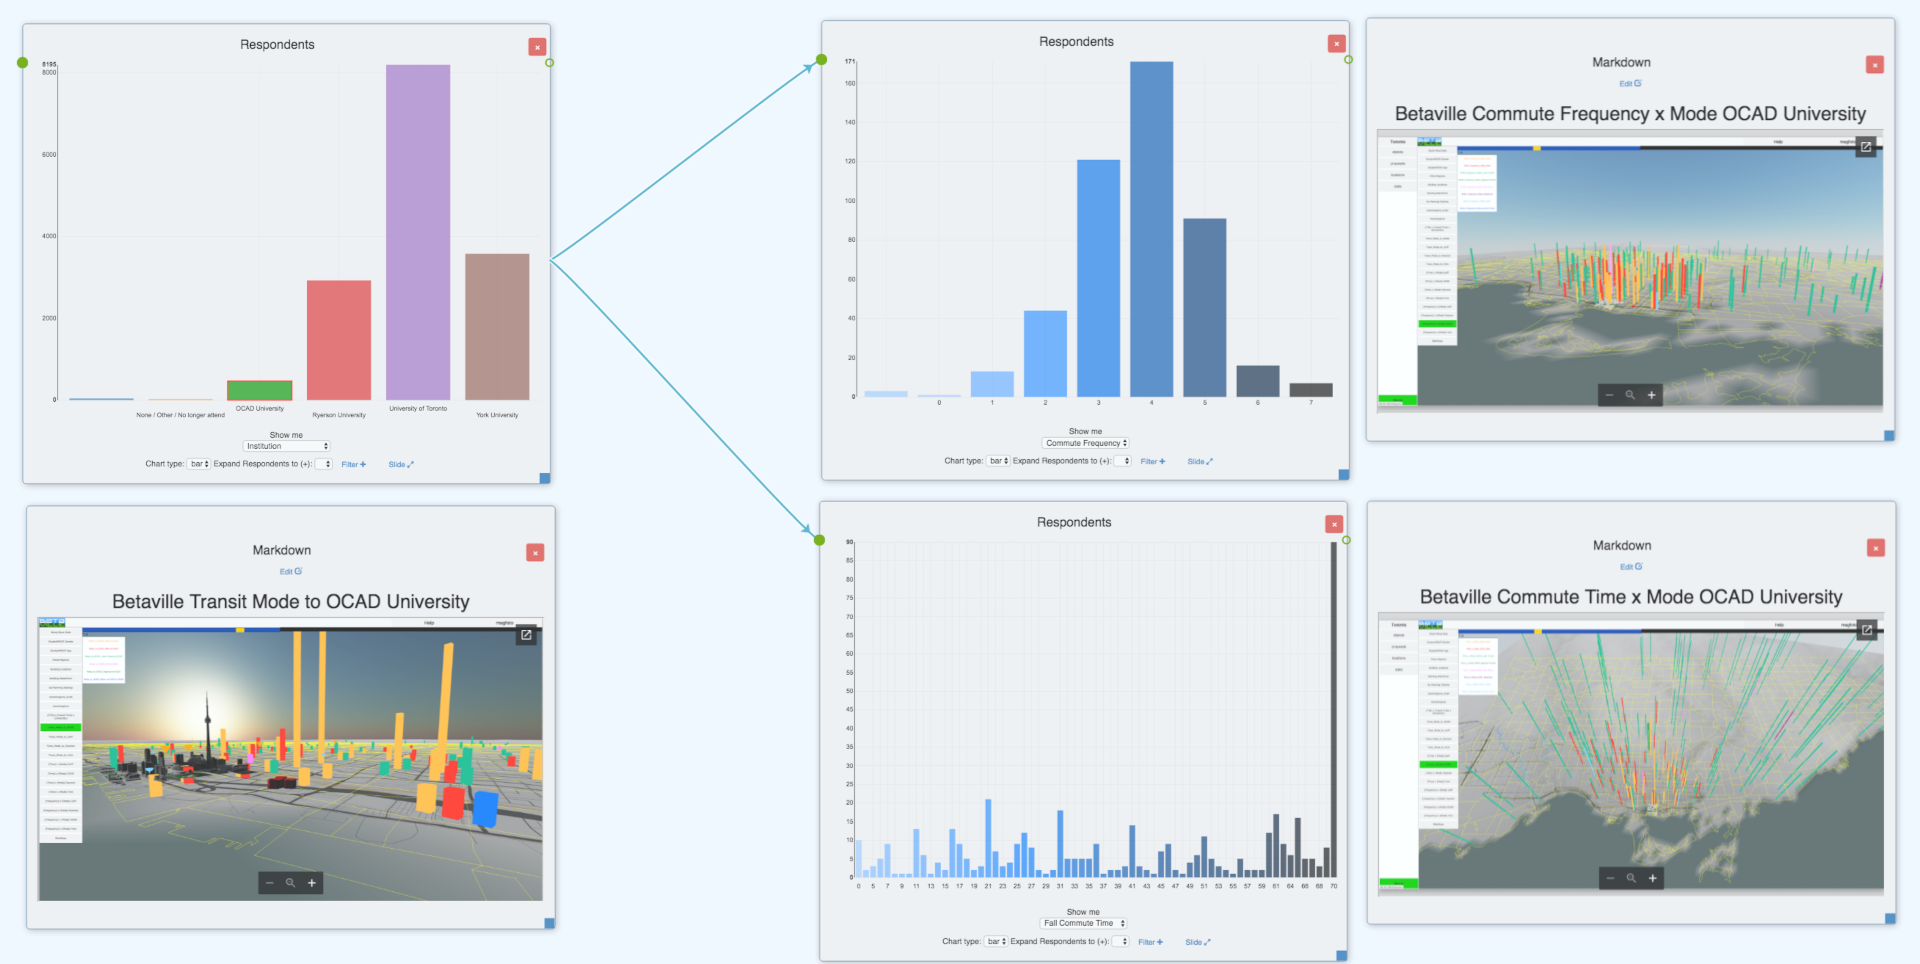
Visualization and visual analytics tools can provide critical support for experts and stakeholders to understand transportation flows and related human activities. Correlating and representing quantitative data with data from human actors can provide explanations for patterns and anomalies. We conducted research to compare and contrast the capabilities of several tools available for visualization and decision support as a part of an integrated urban informatics and visualization research project that develops tools for transportation planning and decision making. For this research we used the data collected by the StudentMoveTO (Toronto) survey which was conducted in the fall of 2015 by Toronto's four universities with the goal of collecting detailed data to understand travel behaviour and its effect on the daily routines of the students. This paper discusses the usefulness of new software which can allow designers to build meaningful narratives integrating 3D representations to assist in Geo-spatial analysis of the data.
Authors
Carl Skelton
Manpreet Kaur Juneja

Jeremy Bowes
Steve Szigeti
Minsheng Zheng
Marcus Gordon
Sara Diamond
Citation
Analyzing student travel patterns with augmented data visualizations
Carl Skelton, Manpreet Kaur Juneja, Cody Dunne, Jeremy Bowes, Steve Szigeti, Minsheng Zheng, Marcus Gordon, and Sara Diamond. Proc. ACM Conference Companion Publication on Designing Interactive Systems—DIS. 2017. DOI: 10.1145/3064857.3079140
Cody Dunne, Vis Lab — Northeastern University
West Village H, Room 302F
440 Huntington Ave, Boston, MA 02115, USA