IDMVis: Temporal event sequence visualization for type 1 diabetes treatment decision support
Abstract
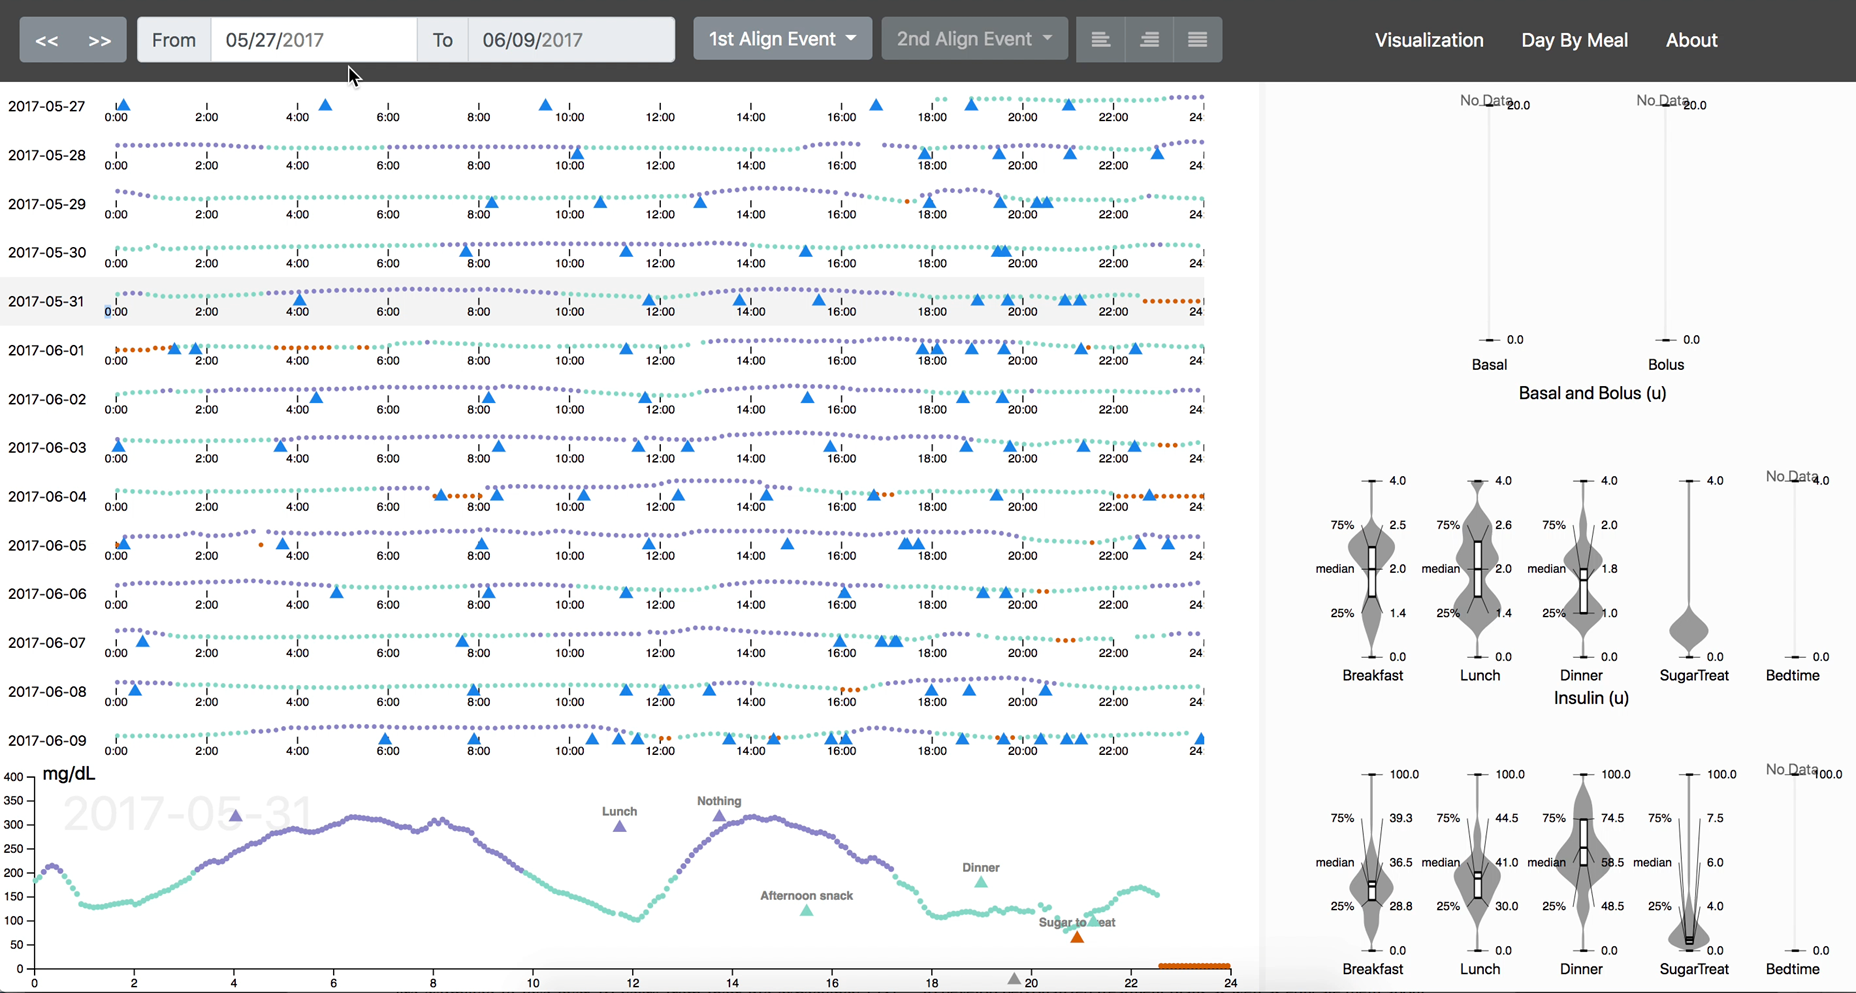
Type 1 diabetes is a chronic, incurable autoimmune disease affecting millions of Americans in which the body stops producing insulin and blood glucose levels rise. The goal of intensive diabetes management is to lower average blood glucose through frequent adjustments to insulin protocol, diet, and behavior. Manual logs and medical device data are collected by patients, but these multiple sources are presented in disparate visualization designs to the clinician—making temporal inference difficult. We conducted a design study over 18 months with clinicians performing intensive diabetes management. We present a data abstraction and novel hierarchical task abstraction for this domain. We also contribute IDMVis: a visualization tool for temporal event sequences with multidimensional, interrelated data. IDMVis includes a novel technique for folding and aligning records by dual sentinel events and scaling the intermediate timeline. We validate our design decisions based on our domain abstractions, best practices, and through a qualitative evaluation with six clinicians. The results of this study indicate that IDMVis accurately reflects the workflow of clinicians. Using IDMVis, clinicians are able to identify issues of data quality such as missing or conflicting data, reconstruct patient records when data is missing, differentiate between days with different patterns, and promote educational interventions after identifying discrepancies.


Citation
IDMVis: Temporal event sequence visualization for type 1 diabetes treatment decision support
Yixuan Zhang, Kartik Chanana, and Cody Dunne. IEEE Transactions on Visualization and Computer Graphics—VIS/TVCG. 2019. DOI: 10.1109/TVCG.2018.2865076
DOI | Code | Demo | Video Preview | Demo Video | BibTeX
Cody Dunne, Vis Lab — Northeastern University
West Village H, Room 302F
440 Huntington Ave, Boston, MA 02115, USA