Evaluating alignment approaches in superimposed time-series and temporal event-sequence visualizations
Abstract
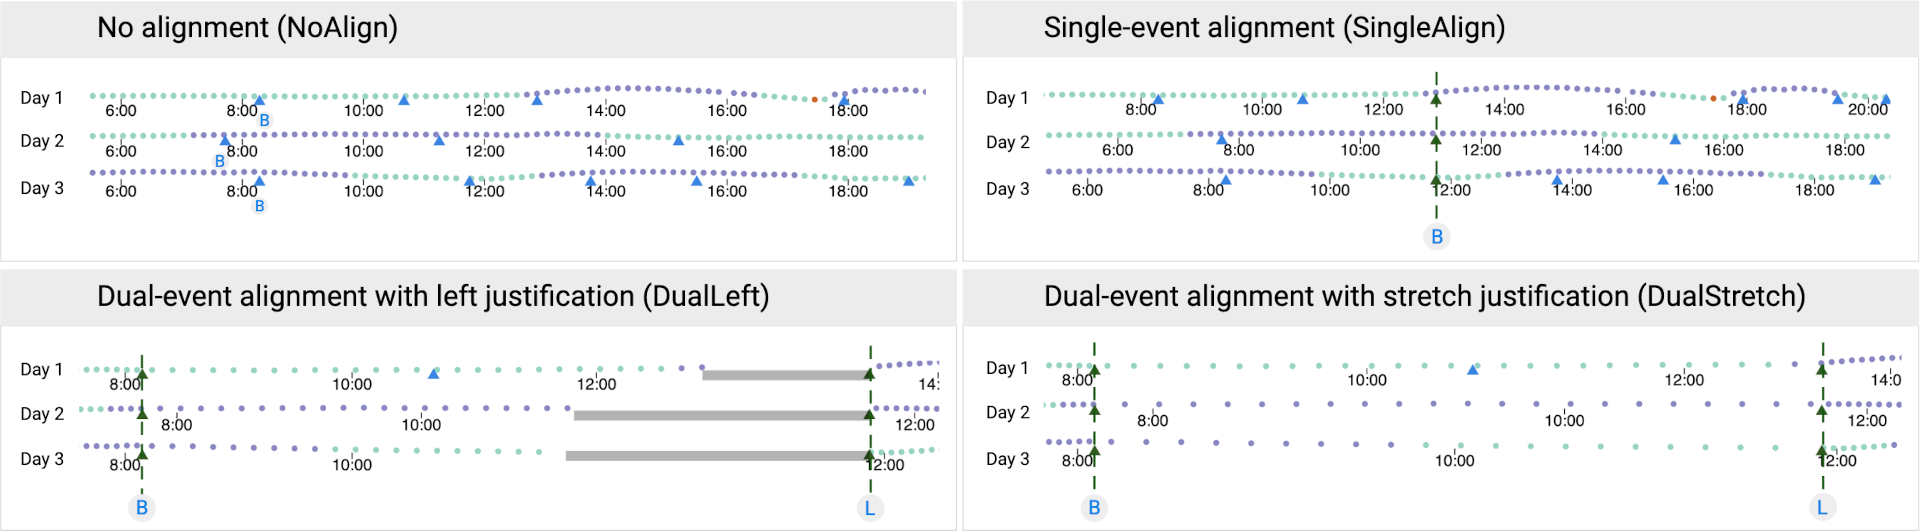
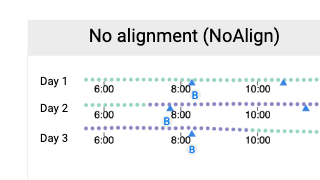
Composite temporal event sequence visualizations have included sentinel event alignment techniques to cope with data volume and variety. Prior work has demonstrated the utility of using single-event alignment for understanding the precursor, co-occurring, and aftereffect events surrounding a sentinel event. However, the usefulness of single-event alignment has not been sufficiently evaluated in composite visualizations. Furthermore, recently proposed dual- event alignment techniques have not been empirically evaluated. In this work, we designed tasks around temporal event sequence and timing analysis and conducted a controlled experiment on Amazon Mechanical Turk to examine four sentinel event alignment approaches: no sentinel event alignment (NoAlign), single-event alignment (SingleAlign), dual-event alignment with left justification (DualLeft), and dual-event alignment with stretch justification (DualStretch). Differences between approaches were most pronounced with more rows of data. For understanding intermediate events between two sentinel events, dual-event alignment was the clear winner for correctness—71% vs. 18% for NoAlign and SingleAlign. For understanding the duration between two sentinel events, NoAlign was the clear winner: correctness—88% vs. 36% for DualStretch—completion time—55 seconds vs. 101 seconds for DualLeft—and error—1.5% vs. 8.4% for DualStretch. For understanding precursor and aftereffect events, there was no significant difference among approaches. A free copy of this paper, the evaluation stimuli and data, and source code are available at osf.io/78fs5.


Citation
Evaluating alignment approaches in superimposed time-series and temporal event-sequence visualizations
Yixuan Zhang, Sara Di Bartolomeo, Fangfang Sheng, and Cody Dunne. Proc. IEEE Visualization Conference—VIS. 2019. DOI: 10.1109/VISUAL.2019.8933584
PDF | Preprint | DOI | Supplement | Video Preview | Video Presentation | BibTeX
Cody Dunne, Vis Lab — Northeastern University
West Village H, Room 302F
440 Huntington Ave, Boston, MA 02115, USA